
The Intersection Myth: Where Security Optimization Really Happens
The "sweet spot" isn't where Cost equals Risk. Most articles get this wrong.
You want to implement a new security tool that costs $500K annually and will reduce breach probability by 15%. Meanwhile, your CFO is evaluating a new product line using standard NPV calculations that completely ignore security risks.
Both of you are making suboptimal decisions. You're solving for safety, they're solving for profit, and neither model connects to the other. You're both missing information.
Isolated decision making
Most organizations make two types of decisions in isolation:
Financial decisions use the familiar formula:
$$Profit = Revenue - Cost$$
Risk decisions happen separately, often focused on minimizing threats regardless of cost.
This separation leads to expensive over-protection in some areas and dangerous under-protection in others.
Revenue, resources, risk
Every business decision involves three factors that pull against each other:
- Revenue (what we gain)
- Resources (what we spend)
- Risk (what we might lose)
To increase revenue, you might need more resources or accept more risk. To reduce risk, you might need more resources or accept lower revenue. To save resources, you might accept more risk or lower revenue.
You can't optimize one without considering the other two.
Why "minimize risk" is wrong
Most security professionals get this wrong: the goal isn't to minimize risk, it's to optimize it.
Risk reduction follows a curve of diminishing returns. Going from 90% protection to 95% might cost as much as going from 0% to 90%. At some point, the cost of additional protection exceeds the value of the risk you're reducing.
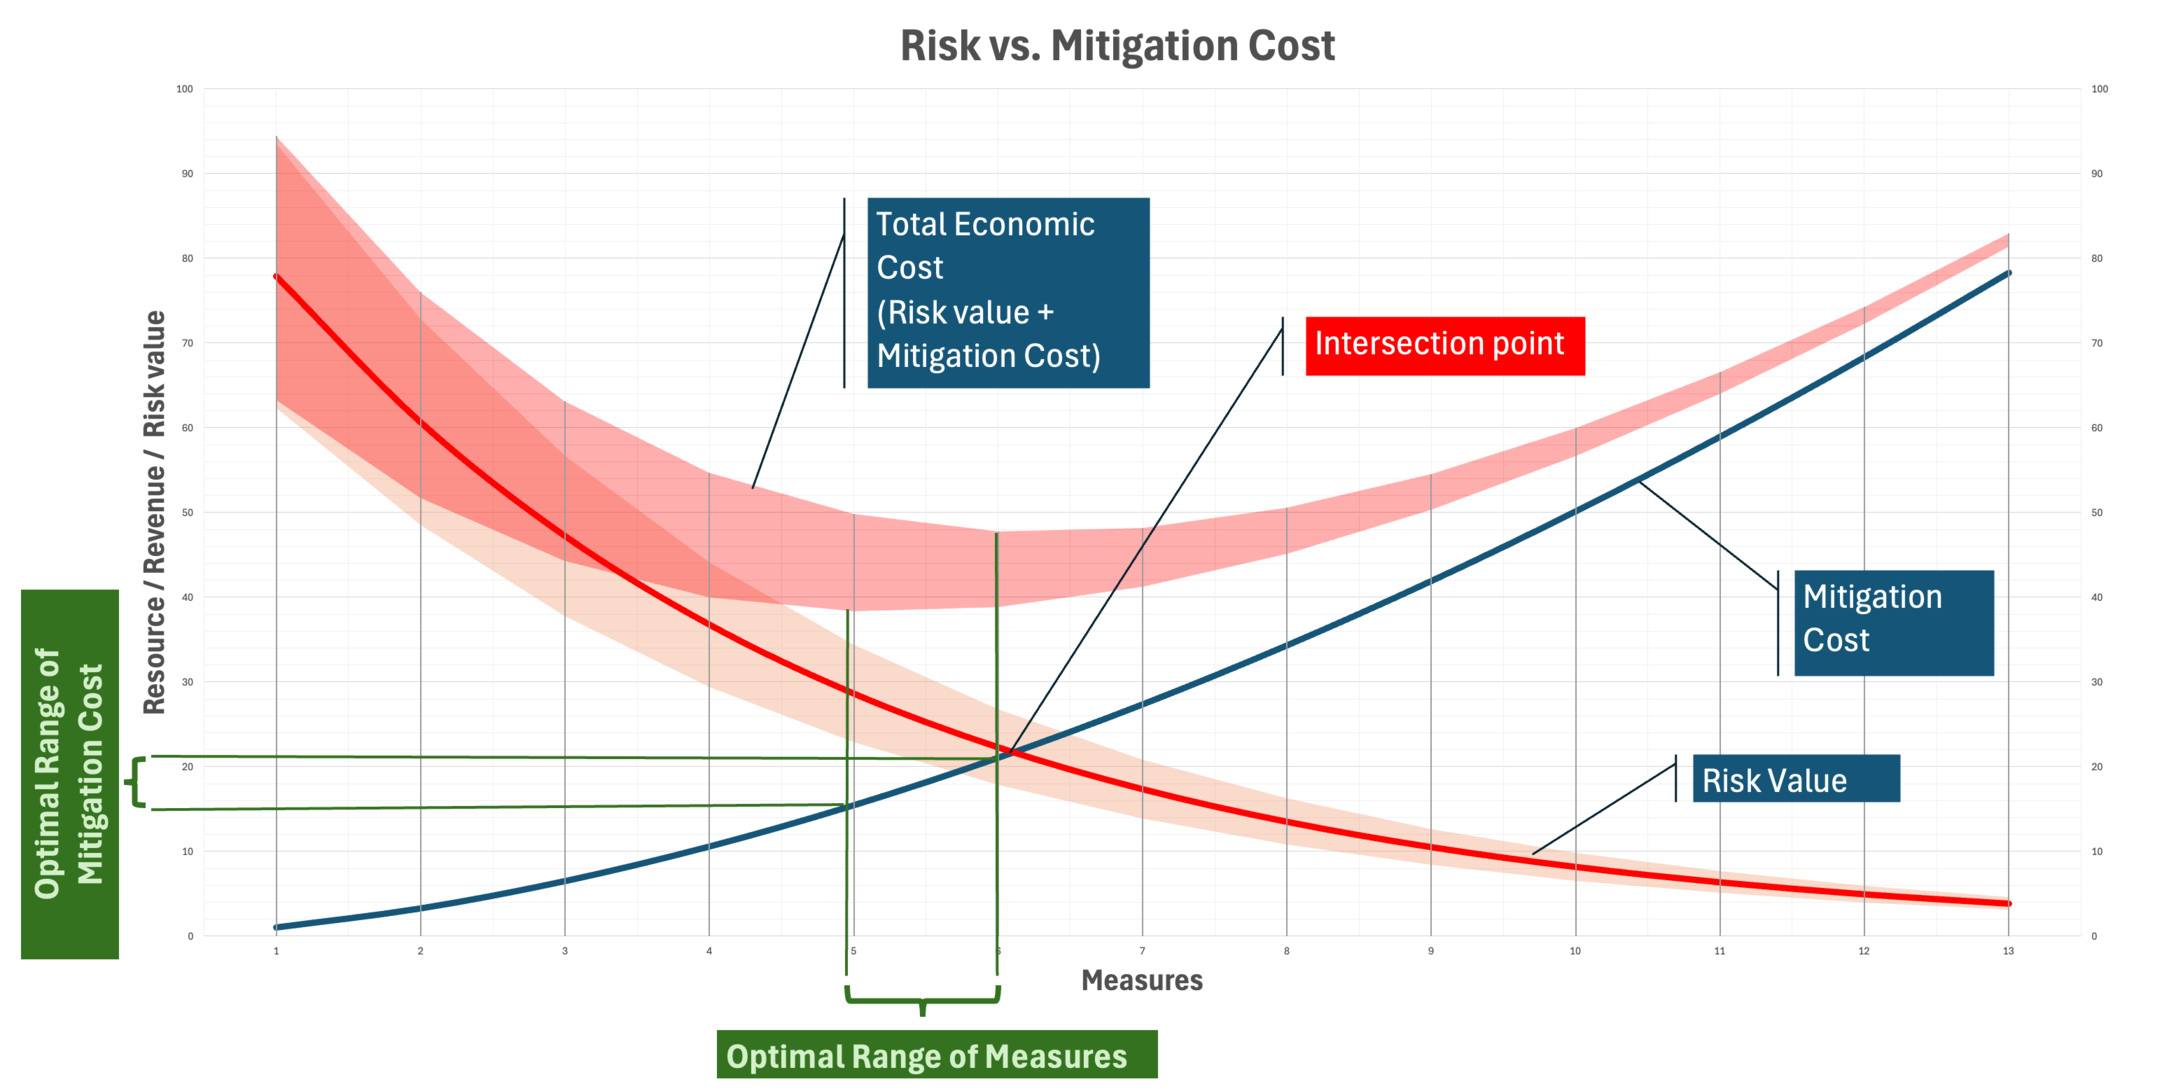
The intersection myth
A lot of articles claim that the "sweet spot" is where your cost curve intersects your risk curve, where the money you're spending equals the risk value remaining.
This is mathematically incorrect.
The optimal point isn't where cost equals risk. It's where the rate of change of cost equals the rate of change of risk reduction. You want the point where spending one more dollar reduces risk by exactly one dollar, not where your total spending equals your total remaining risk.
If you have $10M in risk exposure and you've spent $10M on security (the intersection point), you might still be able to reduce risk by $2 for every additional $1 spent. That's obviously worth doing. You haven't reached the optimal point yet.
The correct approach is marginal analysis, not intersection analysis.
The math (simplified)
In practice, marginal analysis comes down to a simple test:
- If spending $1 more reduces risk by more than $1, spend it
- If spending $1 more reduces risk by exactly $1, you've found the sweet spot
- If spending $1 more reduces risk by less than $1, accept the risk
As you add more security controls, each additional dollar typically yields less risk reduction than the previous dollar. Eventually, you hit a point where additional spending isn't worth it.
Your first $100K in security might eliminate $500K in risk exposure. But your second $100K might only eliminate another $150K in risk. The third $100K might only eliminate $75K in risk. You keep going until the next $100K would only eliminate $100K in risk. That's your optimal point.
Uncertainty and risk assessment quality
Risk isn't a fixed number. It's uncertain. This uncertainty means your optimal point isn't a single spot but a range.
The width of that range depends on how accurate your risk assessment is. Poor risk assessment means high uncertainty and a wide optimal range. Better risk assessment, based on actual system dependencies rather than guesses, narrows that range and makes your decisions sharper.
Your organization's risk appetite should sit somewhere within this optimal range. If it falls outside, you're either under-spending (accepting too much risk) or over-spending (burning resources on diminishing returns).
Back to the $500K tool
Remember the security tool that costs $500K and reduces breach probability by 15%? With marginal analysis, you can actually answer whether it's worth it.
If your current risk exposure is $10M, a 15% reduction is $1.5M in expected risk eliminated for $500K spent. That's $3 of risk reduced per dollar. Spend it. But if you've already driven risk exposure down to $2M through previous investments, that same 15% reduction is only $300K for a $500K tool. You're past the optimal point.
Your CFO's product line decision has a similar gap. If that new product introduces $800K in additional risk exposure that nobody's accounting for, the NPV calculation is wrong. Not because it's bad finance, but because it's incomplete finance.
The problem was never that security teams and finance teams use different frameworks. The problem is that neither framework includes all three variables. Once it does, the $500K question answers itself.
Better risk assessment narrows the uncertainty around these numbers. Graph-native threat analysis that maps actual blast radius gives you tighter ranges than a risk matrix ever will. But even rough marginal analysis beats the intersection myth or gut feel.
-- This article originally published on Medium